How to make a slider map
| (1) See Thomas' presentation Make a free account on Arcgis: https://www.arcgis.com/home/index.html Follow slides 18-19-20 for the signup:
| |
| (2) Click on 'Make a map' Choose a basemap. This one is 'Topographic' | 
|
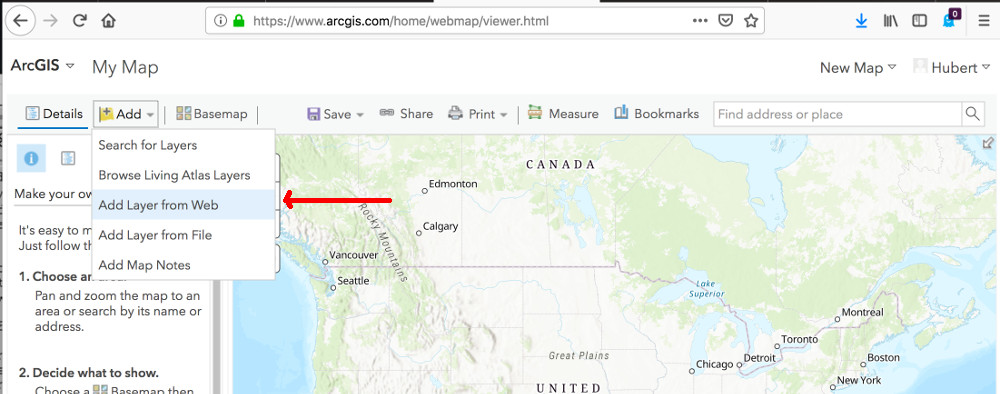
| (3) Add Layer from Web This pops up a panel asking for data: 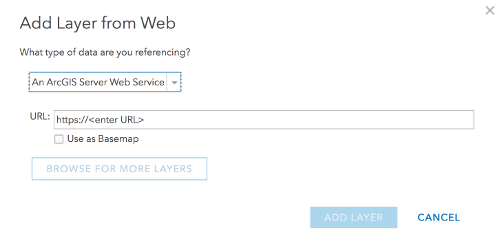
| 
|
| (4) Now we need to find some data In a separate tab, go to the orcsgirls mapping project page. →
First we'll go to the April 23 set. Copy the string bit.ly/ORCSDataApr23,
and paste it into the popup window we have in (3). These data are
in a CSV (comma-separated values) format, so also change the format from
'An ArcGIS...Service' to 'A CSV file'
| 
|
| (5) Now a popup window appears as shown on the right. It says that the data was read, but GIS does not recognize the column headers. We want the columns that are named Lat and Long in the table, and click on 'Not used', and change it to 'Longitude' and 'Latitude', respectively. then hit ADD LAYER | 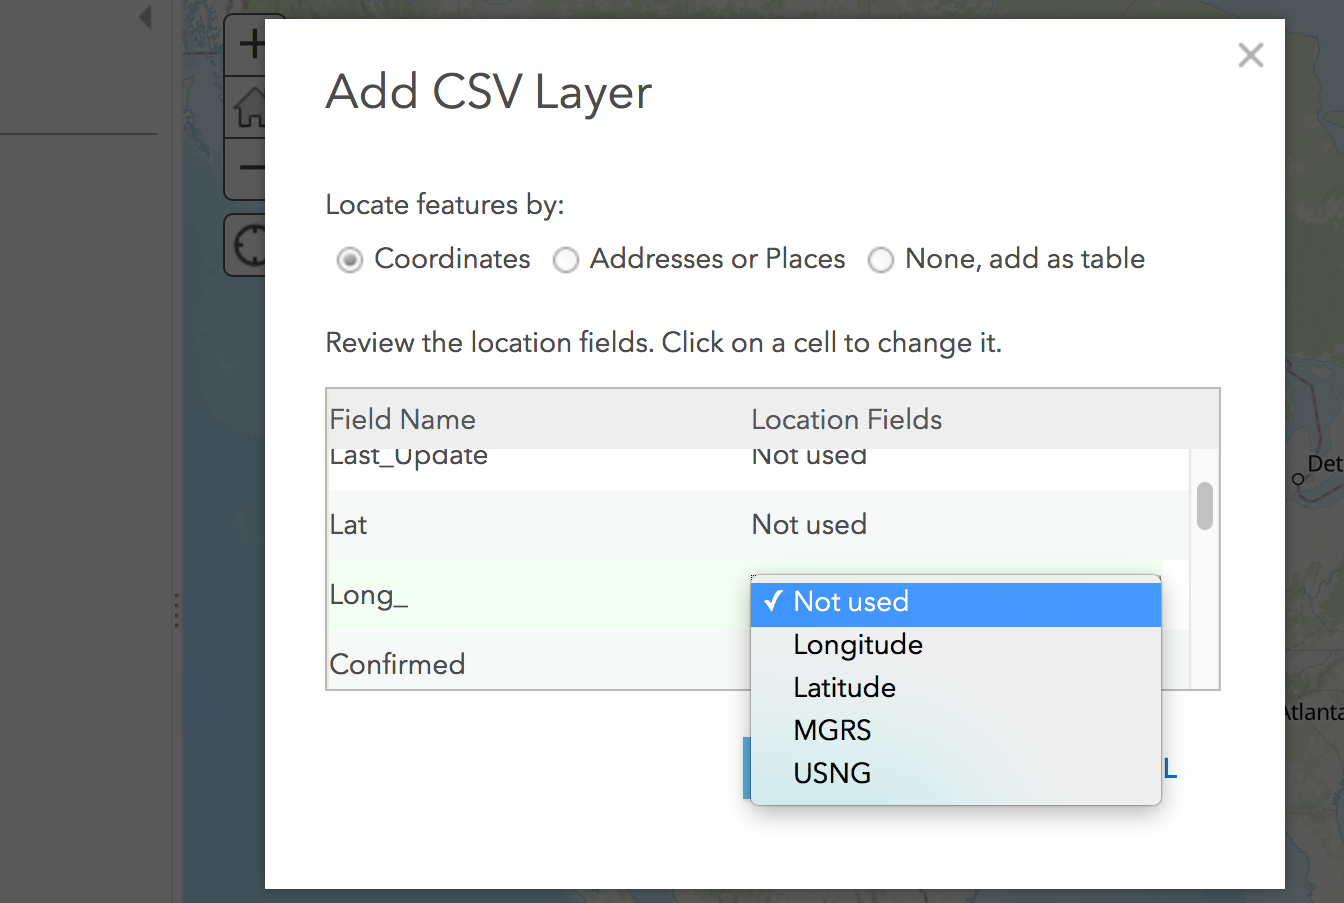
|
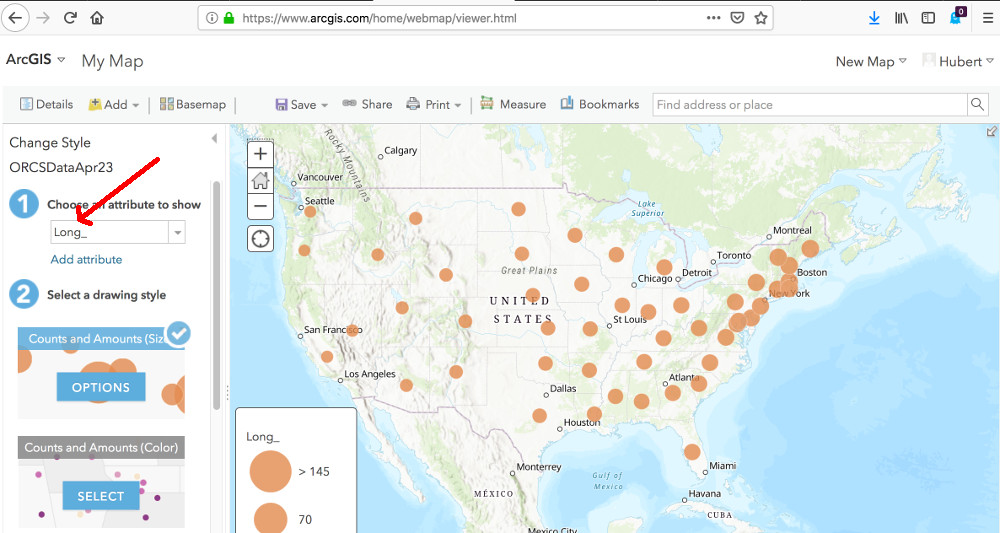
| (6) You get a warning popup, but just ignore that. We now have a map showing one dot per state. This is not very informative, note the attribute plotted is 'Long_', and the result is one dot per state, with size varying from East to West.
| 
|
| (7) Change Long_ to Incident_rate. This is the number of cases per unit population, which gives a fairer comparison between states with large and small populations. Also, we'll set th dot size | 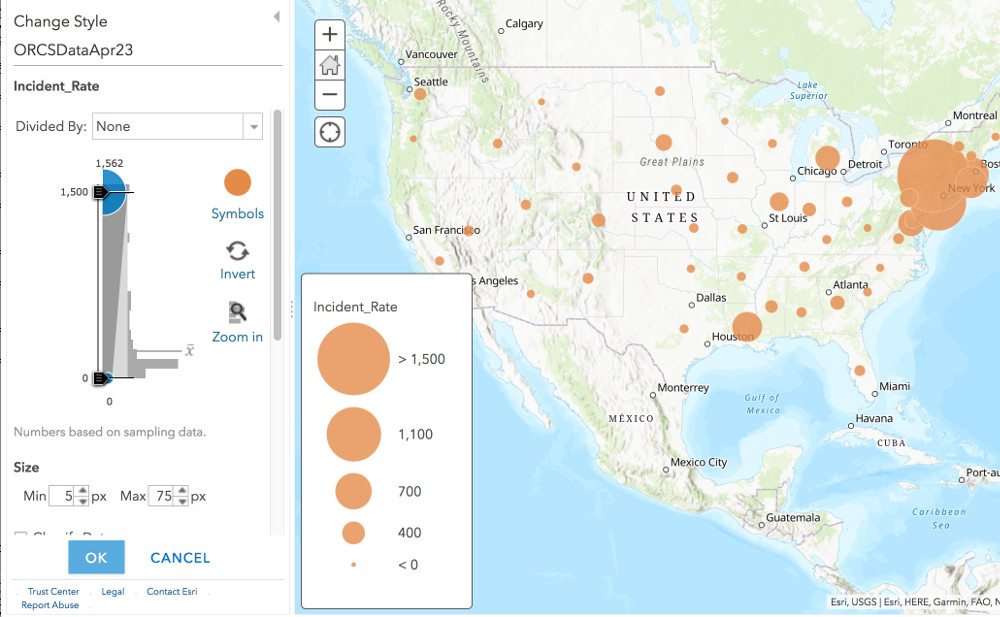
|
| (8) (I'm still working on this...) | 
|
| (9) | 
|
| (10) | 
|
| (11) | 
|
| (12) | 
|
| (13) | 
|
| (14) | 
|
Hubert van Hecke Last modified: Fri Jun 19 10:21:52 MDT 2020
