The magnetic North pole is the point to which the needle of a compass points. The magnetic North pole is not in the same place as the 'real' North pole, the point where the (imaginary) rotational axis of the earth sticks into the ice. The magnetic pole wanders all around the northern wastes, and it is in a different place from year to year.
Here is a map of where the magnetic pole has been since 1831, and another map that goes from 1600 to 2000.

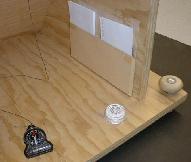 The first thing to do is to align the sunspotter with true North. There
is a small compass on a string. On the base there is a line, which
points to the local magnetic north. Put the compass over the line, and
rotate the whole sunspotter until the line is aligned with the compass'
North-South direction. The base of the sunspotter now points to true
North.
The first thing to do is to align the sunspotter with true North. There
is a small compass on a string. On the base there is a line, which
points to the local magnetic north. Put the compass over the line, and
rotate the whole sunspotter until the line is aligned with the compass'
North-South direction. The base of the sunspotter now points to true
North.
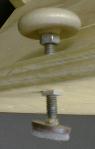 Next use the three adjustable feet to level the base. There is a bubble
level glued to the base for this purpose. After leveling, re-check the
compass to make sure the thing hasn't moved off North during leveling.
Next use the three adjustable feet to level the base. There is a bubble
level glued to the base for this purpose. After leveling, re-check the
compass to make sure the thing hasn't moved off North during leveling.
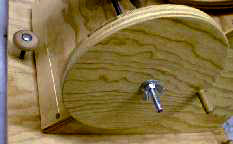
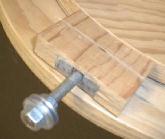 Loosen the knob for gross adjustment of the rotation. Hold the scope
while you do this so it does not slam down. Rotate the scope so it
roughly points at the sun, and tighten the knob again.
Loosen the knob for gross adjustment of the rotation. Hold the scope
while you do this so it does not slam down. Rotate the scope so it
roughly points at the sun, and tighten the knob again.
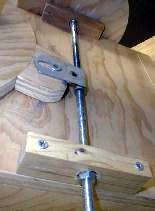
 Loosen the big knob for gross up-down adjustment. Hold the scope while
you do this, so it does not slam down. Move the scope up or down to
roughly point at the sun. Tighten the knob again.
Loosen the big knob for gross up-down adjustment. Hold the scope while
you do this, so it does not slam down. Move the scope up or down to
roughly point at the sun. Tighten the knob again.
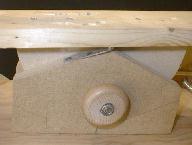
 Use the big wheel for fine-adjustment of the rotation. This allows you to smoothly
follow the sun's movenment in the 'horizontal' direction,
Use the big wheel for fine-adjustment of the rotation. This allows you to smoothly
follow the sun's movenment in the 'horizontal' direction,
 And use the knob
under the front end of the scope to fine-adjust image of the sun onto the
card holder in the vertical direction. If you are leveled and pointed to true North,
this will not be necessary very often.
And use the knob
under the front end of the scope to fine-adjust image of the sun onto the
card holder in the vertical direction. If you are leveled and pointed to true North,
this will not be necessary very often.
 After following the sun for a while, the piece that moves the disk has rotated clockwise
to the end of it's range, and you won't be able to follow the sun any more. Crank it
all the way back again, and use the gross-adjust knob to point the scope at the sun again.
After following the sun for a while, the piece that moves the disk has rotated clockwise
to the end of it's range, and you won't be able to follow the sun any more. Crank it
all the way back again, and use the gross-adjust knob to point the scope at the sun again.
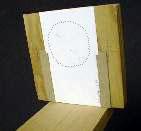 Slip an index card into the card holder, all the way down.
This card should have a circle drawn on it that
exactly matches the image of the sun. (Make a bunch of cards like that, making sure
that the circles you draw are in precisely the same place on each card.)
Use the fine adjusts to get the image of the sun to coincide with the circle.
Slip an index card into the card holder, all the way down.
This card should have a circle drawn on it that
exactly matches the image of the sun. (Make a bunch of cards like that, making sure
that the circles you draw are in precisely the same place on each card.)
Use the fine adjusts to get the image of the sun to coincide with the circle.